
|
||||||||||||||||||||||||||||||||||||||||||||
|
||||||||||||||||||||||||||||||||||||||||||||
The widening difference between what households can afford and what’s available has led many policymakers across the country to try to address the issue. For instance, according to the National Conference of State Legislatures, virtually every state’s legislature has had a bill to deal with affordable housing (blue bars in the figure to the right are the count of states with affordable housing legislation in a given year). The number of pieces of legislation dealing with affordable housing has exploded, going from 31 in 2019 to 379 in 2025.
The number of pieces of legislation dealing with the issue suggests that there is no easy answer to the issue.
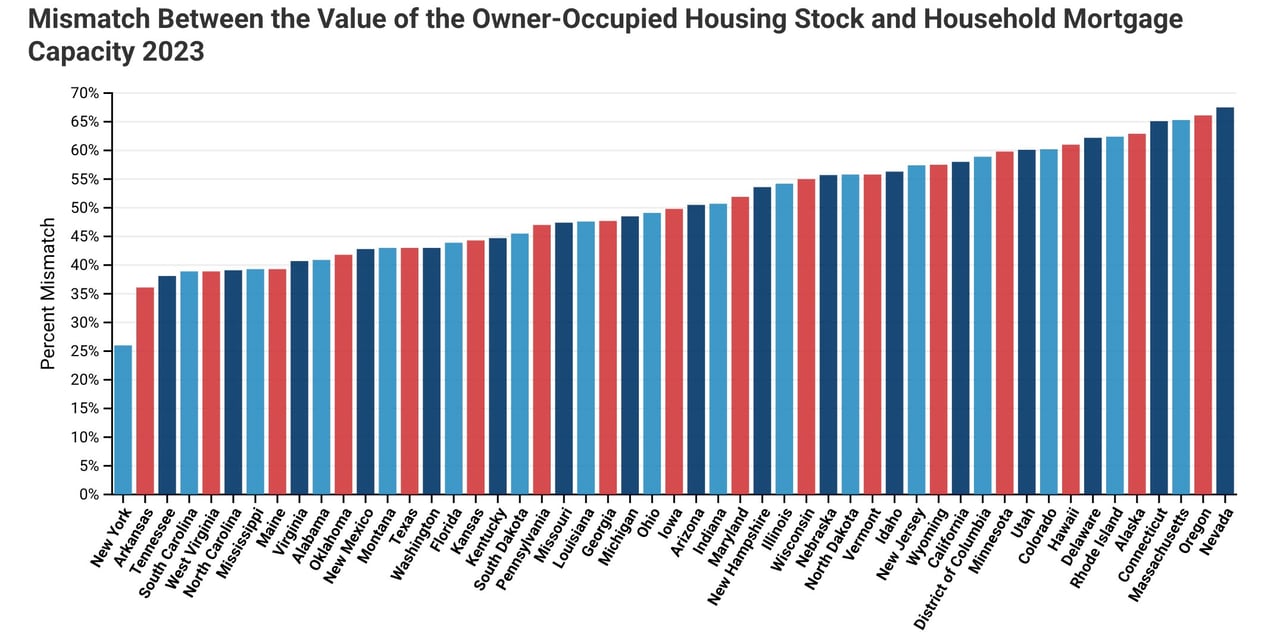
This study looks at the alignment of housing supply and demand, where demand is based upon what households can afford based upon their income. Each group shows the percentage of houses priced in a given group and the percentage of households with incomes sufficient to pay for a house in that group. Each group has a mismatch rate. A 0% mismatch between mortgage capacity and the housing stock means that the distribution of household mortgage capacity exactly matches the distribution of the value of owner-occupied housing. A 100% mismatch means a complete mismatch, where households cannot afford any of the housing stock. Since 2010, the median value of owner-occupied housing in Colorado has increased 132.6% from $236,600 to $550,300 in 2023. Over the same period median household income has increased 71.9% from $54,046 to $92,911. The mismatch in the value of owner-occupied homes and the mortgage capacity of households was 46.8% in 2010 and increased to 60.2% in 2023.
The result of this analysis is that there are too few owner-occupied homes valued below $300,000 and too many homes valued at $300,000 and up. This is partially responsible for the large increase in the supply of rentals, both homes and apartments.
This report details household mortgage capacity and owner-occupied housing values for the state in comparison to all states and the District of Columbia, and the following counties: Adams, Arapahoe, Boulder, Broomfield, Denver, Douglas, El Paso, Jefferson, Larimer, Mesa, Pueblo, and Weld.
This analysis shows that the distribution of household mortgage capacity, based on income alone, differs substantially from the value of owner-occupied housing. Statewide and among the 12 counties in this analysis, there is a shortage of homes priced at $299,999 or less and a surplus of homes priced $300,000 or more. The reason for the shortage and the surplus is the large increase in home prices over the last ten years and high mortgage interest rates that have not been matched by increases in household income.
In comparison to all other states and the District of Columbia, Colorado ranks 9th highest in the difference between the value of owner-occupied housing and household mortgage capacity. This positions Colorado at a competitive disadvantage for attracting new business and workers.